
Observability Stack: Architecture for multi-agent AI systems
TL;DR: Autonomous AI agents are learning to write code, debug themselves, and orchestrate dozens of parallel workstreams. They’re fast. They’re tireless. And they’re producing systems so complex that no single human can keep track of what’s happening inside.
When agents are building agents, who watches the watchers?
The answer is observability: the discipline of making invisible systems visible, so agents can debug themselves better. Just as you’d install cameras, alarms, and dashboards in a factory before turning the robots loose, you need telemetry, tracing, and alerting before you let AI agents run unsupervised.
This post, based on my lessons learnt from building an agent loop_engineering factory, walks through a self-hosted observability stack that gives you end-to-end visibility into AI agent systems: from the language model generating tokens, through the workflow engine orchestrating tasks, down to the applications they produce. Built on Prometheus, Grafana, Phoenix, Loki, and the OpenTelemetry Collector. Deployed locally. Fully self-hosted. Zero cloud lock-in.
1. The Stack
An observability stack for AI agent systems needs to handle three telemetry signals: traces (what happened and in what order), metrics (how the system is performing), and logs (what went wrong). Here’s the layering:
Tracing. Arize Phoenix is the tracing backend, capturing every LLM call, tool invocation, and conditional branch with unique run_id propagation. Alternatives like LangSmith or LangFuse (OSS) serve the same purpose. Phoenix was chosen for its self-hosted, evaluation-focused design.
Telemetry Backbone. OpenTelemetry (OTel) is the signal router. It ingests traces, metrics, and logs from any source and distributes them to the right storage backend. OTel is vendor-neutral, so your observability data isn’t locked into one provider.
State & Checkpointing. LangGraph’s native checkpoint system persists state at every workflow node and HIL gate, scaling from SQLite in development to PostgreSQL in production. This enables rollback, resume, and diff-based reflection, which is critical for debugging agent behavior.
Structured Logging. loguru or structlog replace raw print() calls with context-aware logs that auto-inject trace and run IDs. Every log line is queryable and correlated to a specific agent execution.
Metrics. Prometheus scrapes numerical time-series data from application endpoints, while Grafana renders it into dashboards. Prometheus is pull-based (it asks targets for data), which simplifies the architecture: no push registry needed.
Error Wrappers. Custom SemanticError middleware catches LLM and tool failures, extracts root cause, and formats them into structured repair prompts. Errors become first-class telemetry, not dead ends.
Visualization. LangGraph Studio and the Phoenix UI let you replay execution paths, compare iteration diffs, and inspect agent reflection history. Seeing what an agent actually did is the fastest path to debugging it.
Services at a Glance
| Service | Image | Host Port | Role |
|---|---|---|---|
| Prometheus | prom/prometheus:latest | :9090 | Pull-based metrics collection |
| Grafana | grafana/grafana:latest | :3000 | Dashboard visualization (login: admin/admin) |
| Phoenix | arizephoenix/phoenix:latest | :6006 | AI/LLM tracing: evaluate generations, prompts, latency |
| Loki | grafana/loki:3.0.0 | :3100 | Log aggregation (Grafana-native query via LogQL) |
| OTel Collector | otel/opentelemetry-collector-contrib:latest | :4317 (gRPC), :4318 (HTTP), :8889 (Prom exp) | Signal router: ingests OpenTelemetry, distributes traces to Phoenix, logs to Loki, metrics to Prometheus |
Persistence
Three Docker-managed volumes survive container restarts:
grafana-stack_prometheus_data→/prometheus(TSDB, 15-day retention)grafana-stack_phoenix_data→/app/server/phoenix.db(SQLite)grafana-stack_loki_data→/loki
2. Shared Network Design
The Concept
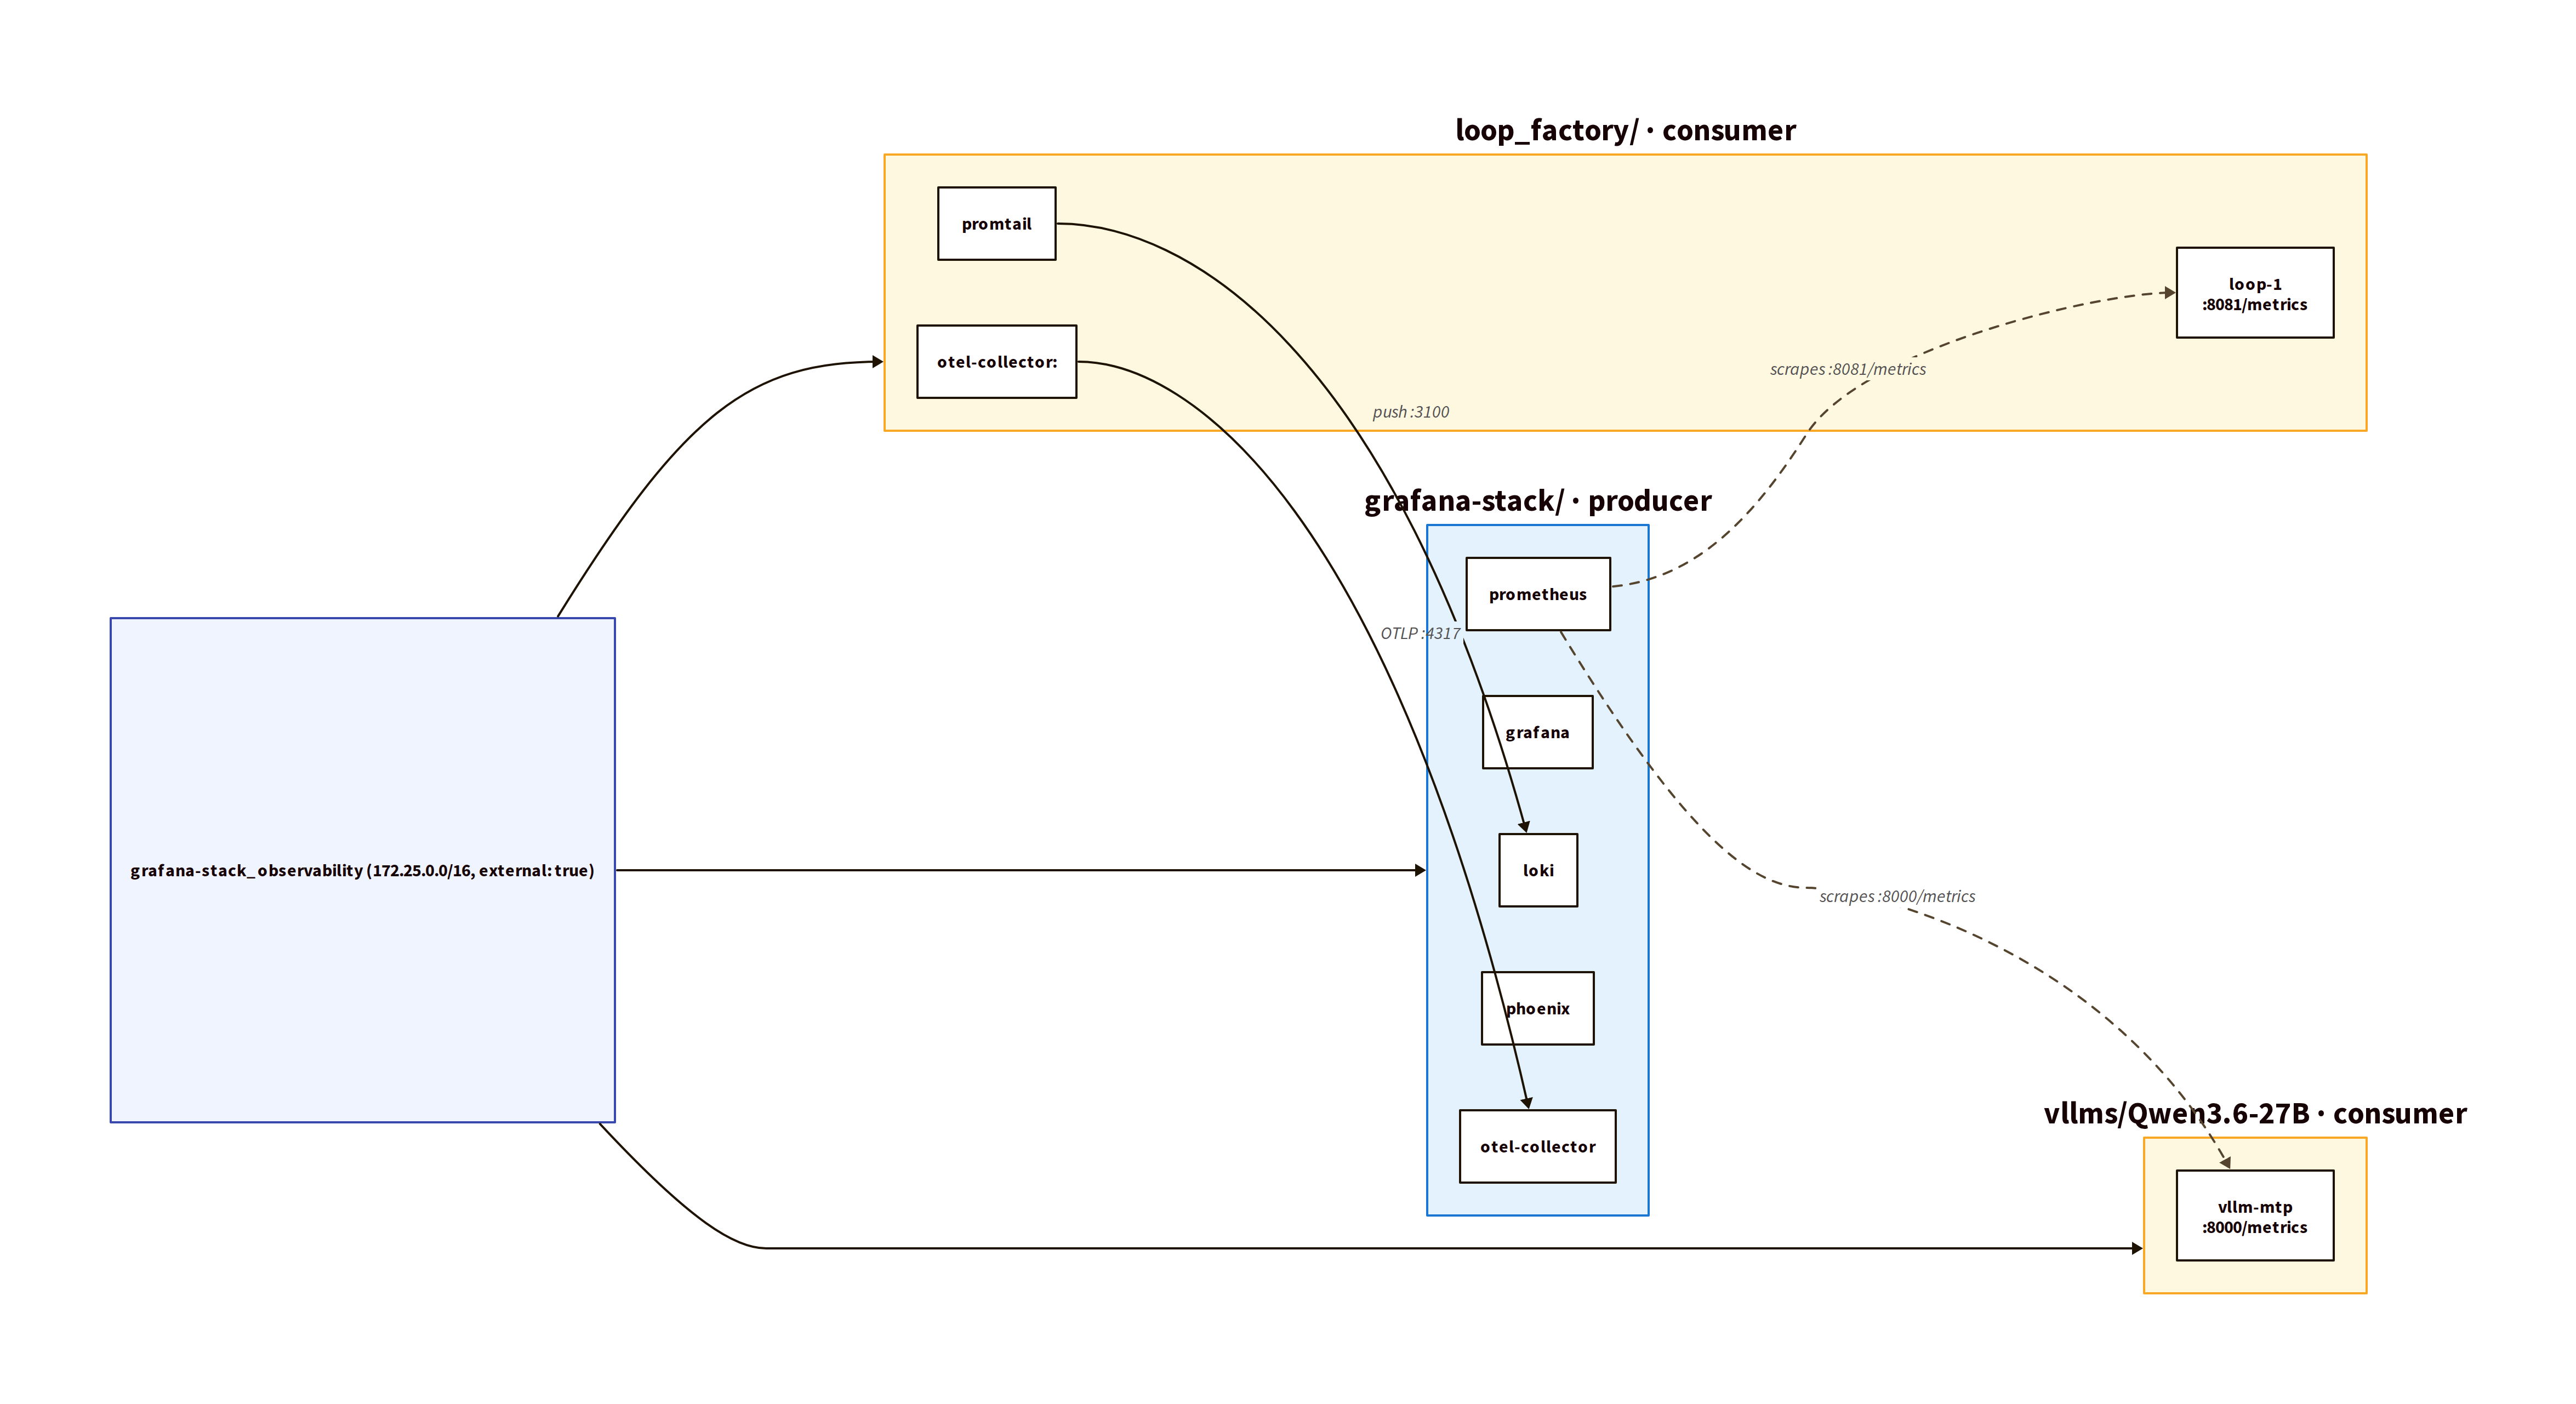
All observability services live on a single Docker bridge network (172.25.0.0/16). Consumer projects (vLLM, Loop Factory) don’t recreate this network; they declare it as external and plug into the existing L2 segment:
networks:
  observability:
    external: true
    name: grafana-stack_observability
One line of YAML. No IP addresses. No port forwarding between projects. Any new container can join the network and immediately become visible to the observability stack.
The external Pattern in practice:
What Connects
| Consumer | Project | What It Sends |
|---|---|---|
vllm-mtp | ~/llms/vllms/Qwen3.6-27B-Text-NVFP4-MTP | Prometheus metrics (/metrics) |
loop_factory-loop-1 | ~/workspace/projects/loop_factory | Prometheus metrics + OTel traces |
loop_factory-otel-collector-1 | Loop Factory | OTel signals to central collector |
loop_factory-promtail-1 | Loop Factory | Logs → Loki |
DNS Resolution
Docker’s embedded DNS resolves container names to IPs within the shared network. Services find each other by name:
http://prometheus:9090(Grafana datasource to Prometheus)http://phoenix:6006(OTel to Phoenix traces)http://loki:3100(OTel to Loki logs)vllm-mtp:8000/metrics(Prometheus scrape target)
No extra_hosts, no hardcoded IPs. The network is the configuration.
3. Data Flow Architecture
Metrics Path (Prometheus, pull-based)
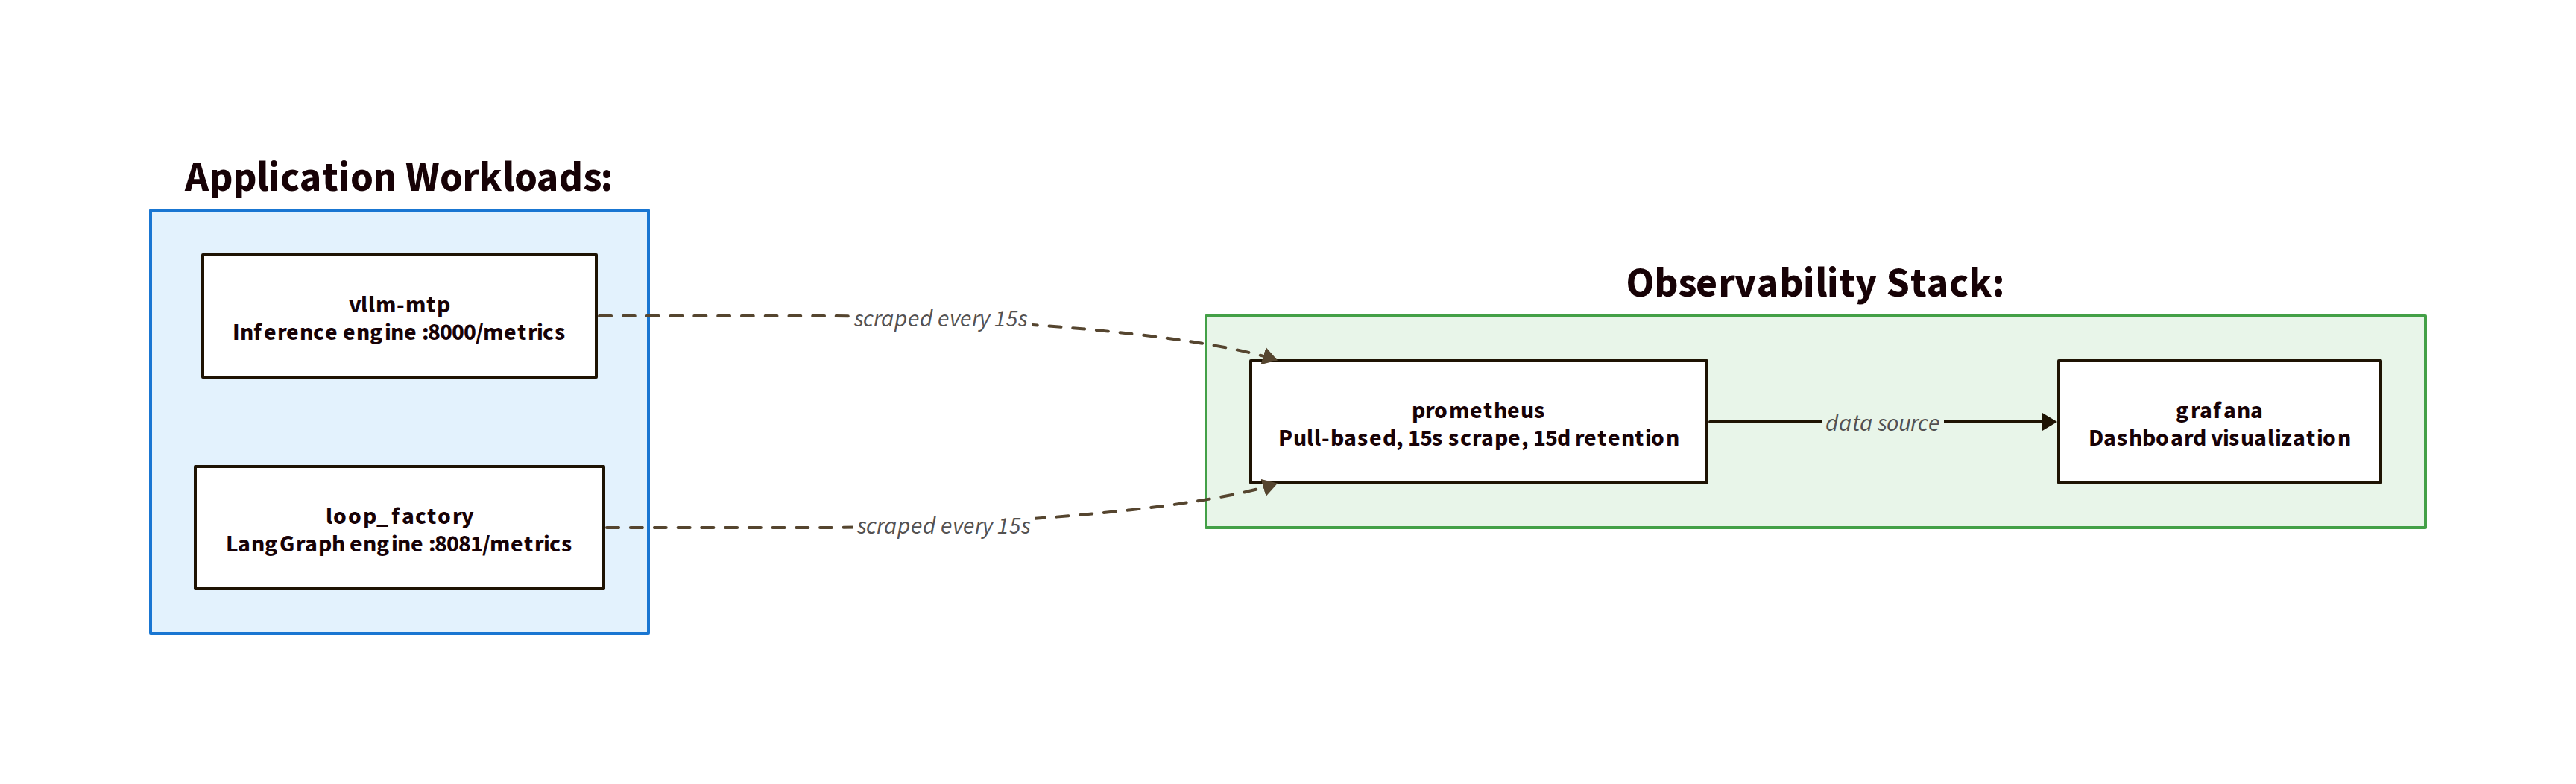
Prometheus scrape config (prometheus.yml):
| Job | Target | Interval | Path |
|---|---|---|---|
vllm | vllm-mtp:8000 | 15s | /metrics |
loop-orchestrator | loop_factory-loop-1:8081 | 15s | /metrics |
prometheus | localhost:9090 | 15s | (self) |
Traces, Logs, Metrics Path (OTel, push-based)
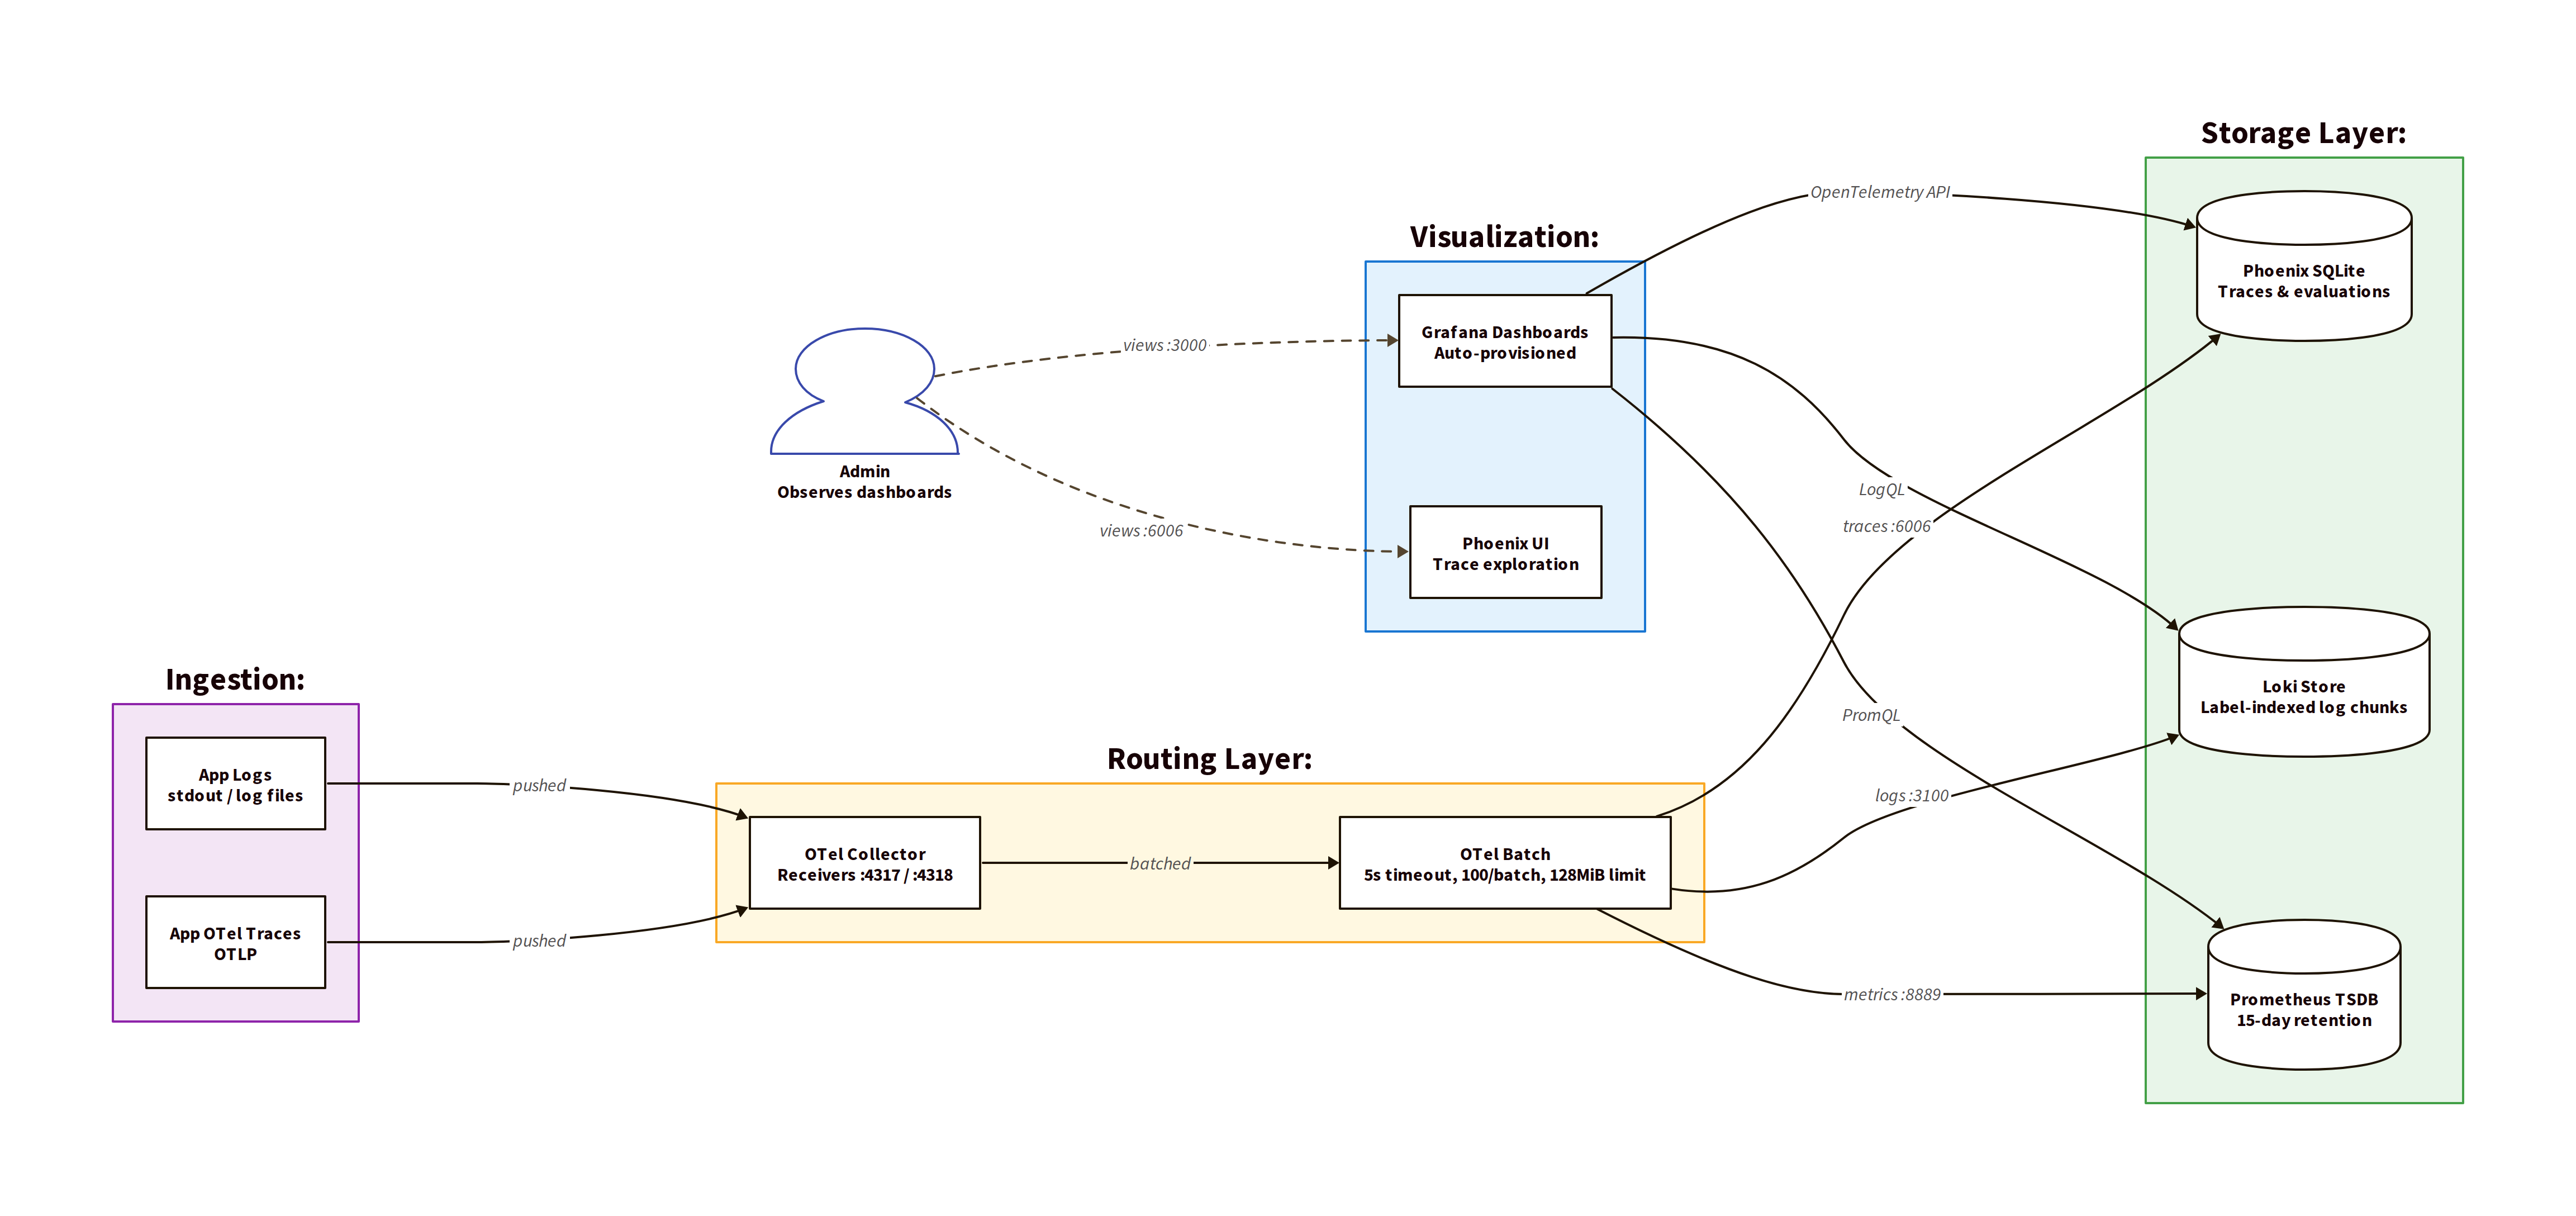
OTel pipelines (otel-collector/config.yml):
| Signal | Receiver | Exporters | Processor |
|---|---|---|---|
| Traces | OTLP (gRPC+HTTP) | Phoenix, Debug | Batch + Memory Limiter |
| Logs | OTLP | Loki, Debug | Batch + Memory Limiter |
| Metrics | OTLP | Prometheus push, Debug | Batch |
Resource guardrails:
- Memory limiter: 128 MiB per collector process
- Batch timeout: 5s, batch size: 100 signals
- Phoenix sending queue: 1000 pending traces
Grafana Provisioning
Grafana is configured entirely through the provisioning/ directory: no manual UI setup needed.
Datasources (provisioning/datasources/prometheus.yml):
| Name | Type | URL | Default? |
|---|---|---|---|
Prometheus | prometheus | http://prometheus:9090 | Yes |
Phoenix | grafana-opentelemetry-app-datasource | http://phoenix:6006 | No |
Loki | loki | http://loki:3100 | No |
Dashboards (provisioning/dashboards/dashboards.yml): Grafana auto-loads JSON dashboard files from /var/lib/grafana/dashboards on a 60-second refresh interval.
4. vLLM Token Dashboard
File: dashboards/vllm-tokens.json UID: vllm-tokens Refresh: 10s
Panels
| # | Panel | Type | Metrics |
|---|---|---|---|
| 1 | Tokens Per Second | Timeseries | rate(generation_tokens_total[1m]), rate(prompt_tokens_total[1m]) |
| 2 | KV Cache Usage % | Timeseries | kv_cache_usage_perc * 100 |
| 3 | Active & Swapped Requests | Timeseries | num_requests_running, num_requests_waiting |
| 4 | Token Latency | Timeseries | Avg inter-token latency, avg TTFT |
| 5 | Prefix Cache & Throughput | Timeseries | prefix_cache_hits_total, iteration_tokens_total |
| 6 | Total Generated Tokens | Stat (cumulative) | generation_tokens_total |
| 7 | Total Prompt Tokens | Stat (cumulative) | prompt_tokens_total |
| 8 | Total Tokens (Input + Output) | Timeseries (cumulative) | generation + prompt tokens |
| 9 | CPU Usage | Timeseries | rate(process_cpu_seconds_total[5m]) * 100 |
| 10 | Memory Usage (RSS) | Timeseries | process_resident_memory_bytes |
| 11 | Generation Tokens Distribution | Barchart (stacked) | Histogram buckets: ≤50, ≤100, ≤200, ≤500, ≤1K, ≤2K, ≤5K, ≤10K, ≤50K, ≤100K |
| 12 | Peak Memory (Last 6h) | Stat | max_over_time(RSS[6h]) |
Key Observations
- Panel 11 (token distribution) spans full width, acting as a visual histogram of output lengths that reveals whether your agents produce short responses or deep reasoning chains
- Panels 6 to 7, 12 are stat panels with color thresholds (red to yellow to green at 1K/10K tokens; memory at 2GB/4GB)
- Dashboard queries reference Prometheus UID
PBFA97CFB590B2093, which is stable because provisioning creates a deterministic datasource ID
5. How Cross-Project Networking Works
The external Pattern
See the network topology diagram above in §2: Shared Network Design.
Mechanism:
grafana-stackcreatesgrafana-stack_observabilityondocker compose up- Consumer projects reference it by name, and Docker finds it in the global network list
- All containers on the network reach each other by container name via embedded DNS
- No port mapping needed between projects; only host-bound ports (
:3000,:9090,:6006) need firewall rules
Why This Design
| Benefit | Explanation |
|---|---|
| Single observability instance | One Prometheus/Grafana/Loki serves all services: no redundant scraping |
| Compose-project isolation | Each service project manages its own containers; only the network is shared |
| Zero config drift | No IP addresses, no extra_hosts entries to maintain |
| Telemetry by default | Any new project can join the network with one line of YAML |
6. Directory Layout
~/your_path/grafana-stack/
├── docker-compose.yml          # Stack orchestration
├── test_observability.sh       # Health-check script
├── prometheus/
│   └── prometheus.yml          # Scrape targets + intervals
├── otel-collector/
│   └── config.yml              # Receivers, exporters, pipelines
├── grafana/                      # Persistent data (grafana.db, plugins)
├── loki/                           # Persistent data
├── dashboards/
│   ├── vllm-tokens.json          # vLLM token dashboard
│   └── vllm-tokens-panel11.json  # Token distribution (backup)
├── provisioning/
│   ├── dashboards/
│   │   └── dashboards.yml        # Auto-provision dashboard folder
│   └── datasources/
│       └── prometheus.yml        # Auto-provision datasources
└── {grafana,/                    # Legacy directory (unused)
7. Operational Notes
Common Commands
# Start stack
cd ~/your_path/grafana-stack && docker compose up -d

# Check health
docker compose ps

# View logs (e.g., OTel collector)
docker compose logs -f otel-collector

# Reset all data (warning: destroys metrics/traces/logs)
docker compose down -v
Adding a New Scrape Target
- Edit
prometheus/prometheus.ymland add ascrape_configblock - Ensure the new service container joins the
grafana-stack_observabilitynetwork - Reload:
docker compose exec prometheus curl -X POST http://localhost:9090/-/reload
Adding OTel Instrumentation
Point your app’s OTel SDK to:
- gRPC:
otel-collector:4317 - HTTP:
otel-collector:4318
The collector handles routing automatically. No per-backend configuration needed in your application code.
References
- Project:
~/your_path/grafana-stack/ - Network:
grafana-stack_observability(172.25.0.0/16, bridge) - Grafana UI:
http://localhost:3000(admin/admin) - Phoenix UI:
http://localhost:6006 - Prometheus UI:
http://localhost:9090